
Clear, Actionable Insights.
Our comprehensive health reporting and analytics provide actionable, data-driven insights about the health and well-being of your workforce or community, without identifying individuals and compromising their trust and participation.
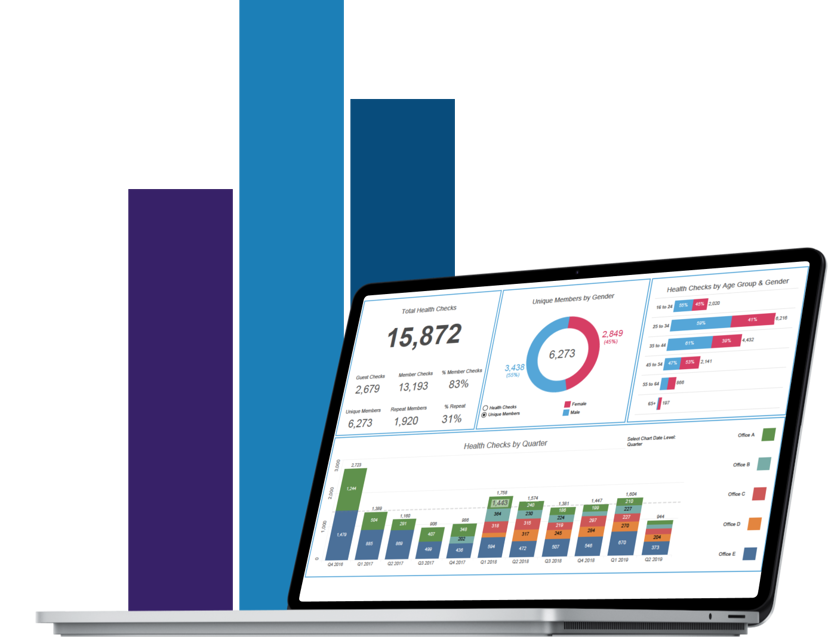
Gain unparalleled data insights.
SiSU Health’s workplace health analytics are comprehensive and best-in-class. From detailed demographic profiles to extensive health risk insights across the population. We also provide insights into health literacy, health change over time, productivity analysis, peer industry benchmarking, user satisfaction and participation. Custom survey questions, research and reporting are also available upon request.
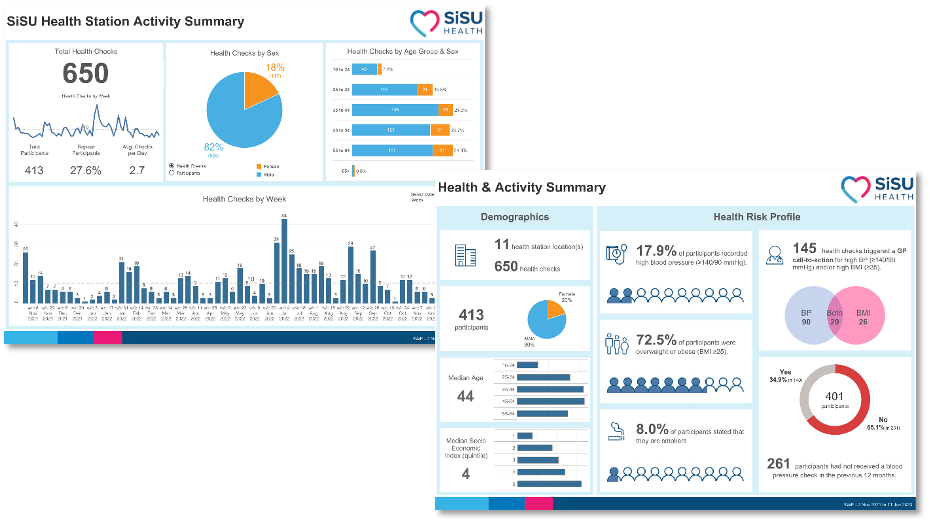
Activity & Health Summary
The Activity & Health summaries provide clear overviews of health station checks over time with breakdowns by sex, age group as well as risk rates, GP call-to-actions for high BP, High BMI or both and count of employees who have had their BP measured in the last twelve months.
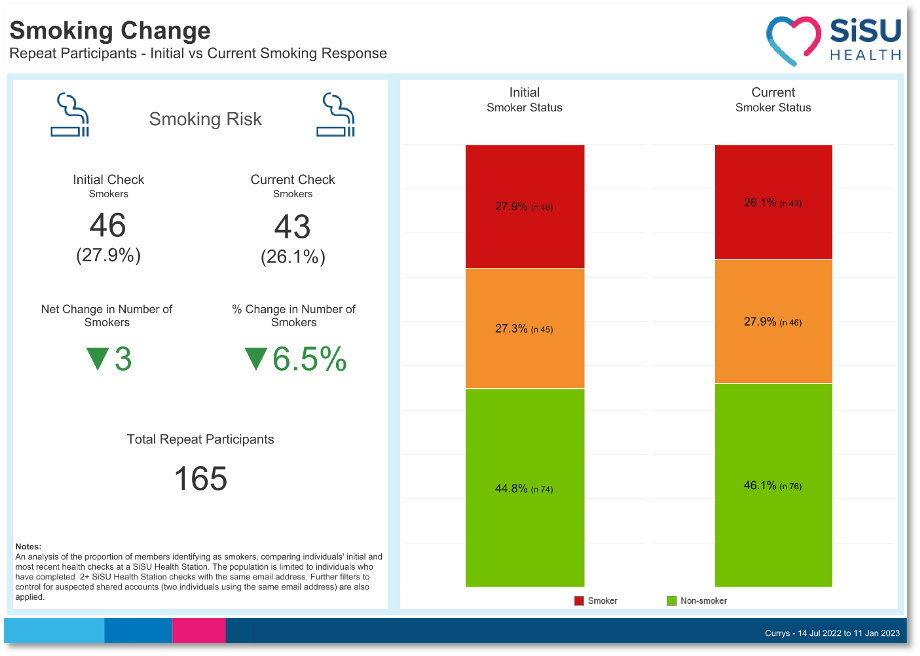
Health Outcome Analysis
Health Outcome Analysis measures the net change in health risks over time, providing a more precise, objective view of the impact of employee health support initiatives.
The difference between a participant’s first and last recent measurement is calculated and then aggregated to show the net change at organisation level.
Health risk prevalence metrics currently included in Health Outcome Analysis are
- Blood Pressure (BP)
- Body Mass Index (BMI)
- Body Fat (BF) percentage risk prevalence and rating-
- Smoking prevalence
- Weight change (kg)
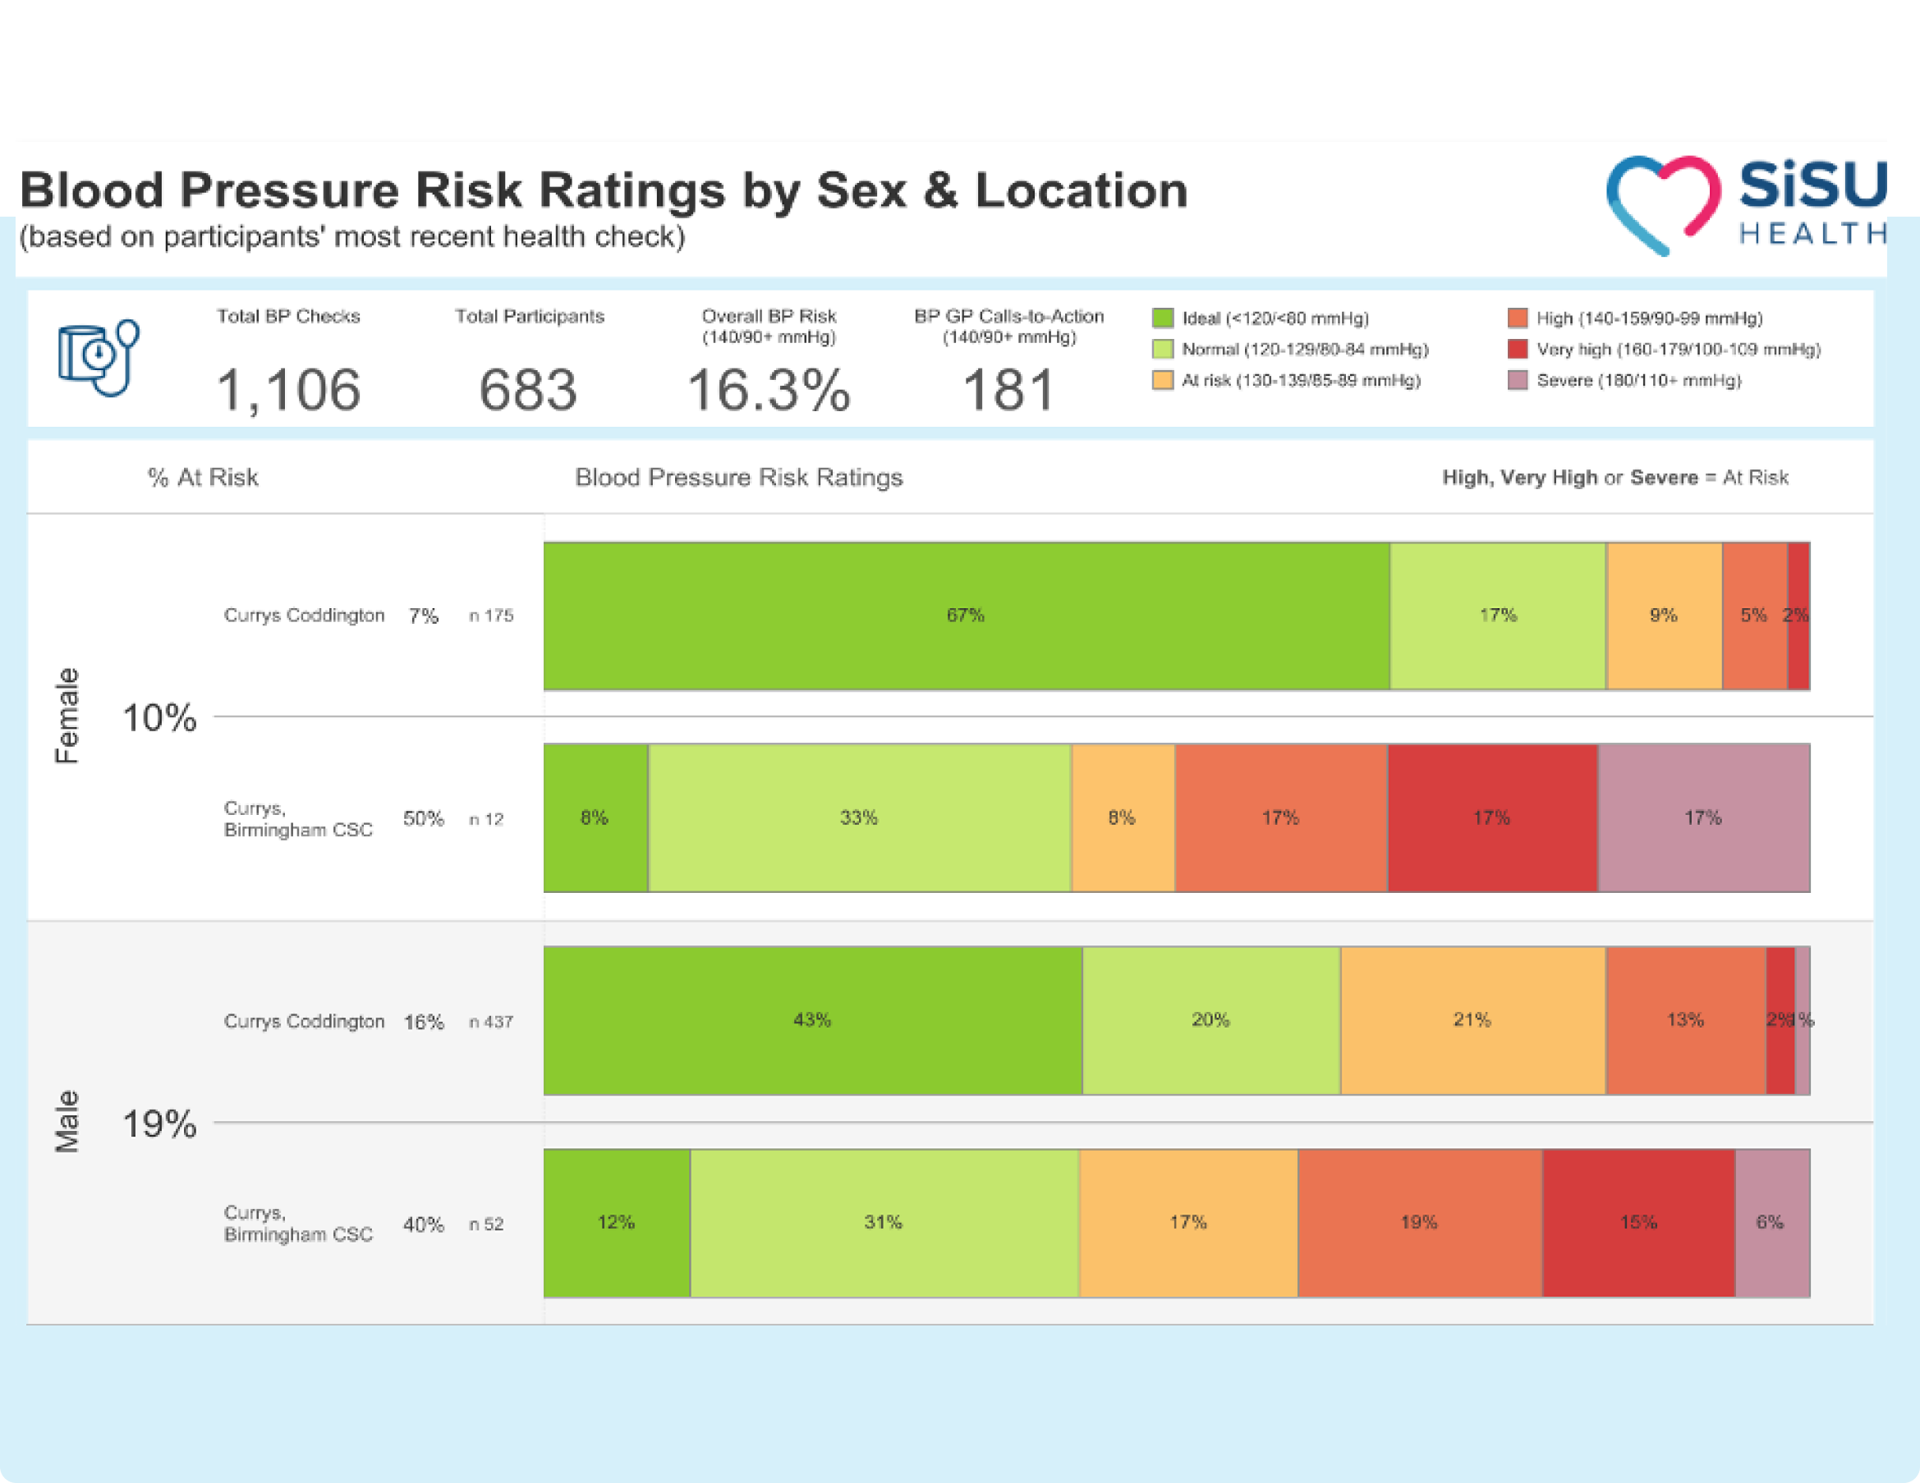
Detailed Health Risk Profiles
Our employee health analytics provide detailed, de-identified distribution breakdowns of the health risks and metrics that matter including blood pressure, BMI, body fat, smoking and perceived stress (PSS-4). These health metrics are presented by sex and location, provided that response sizes exceed a defined threshold as a countermeasure against deductive identification.
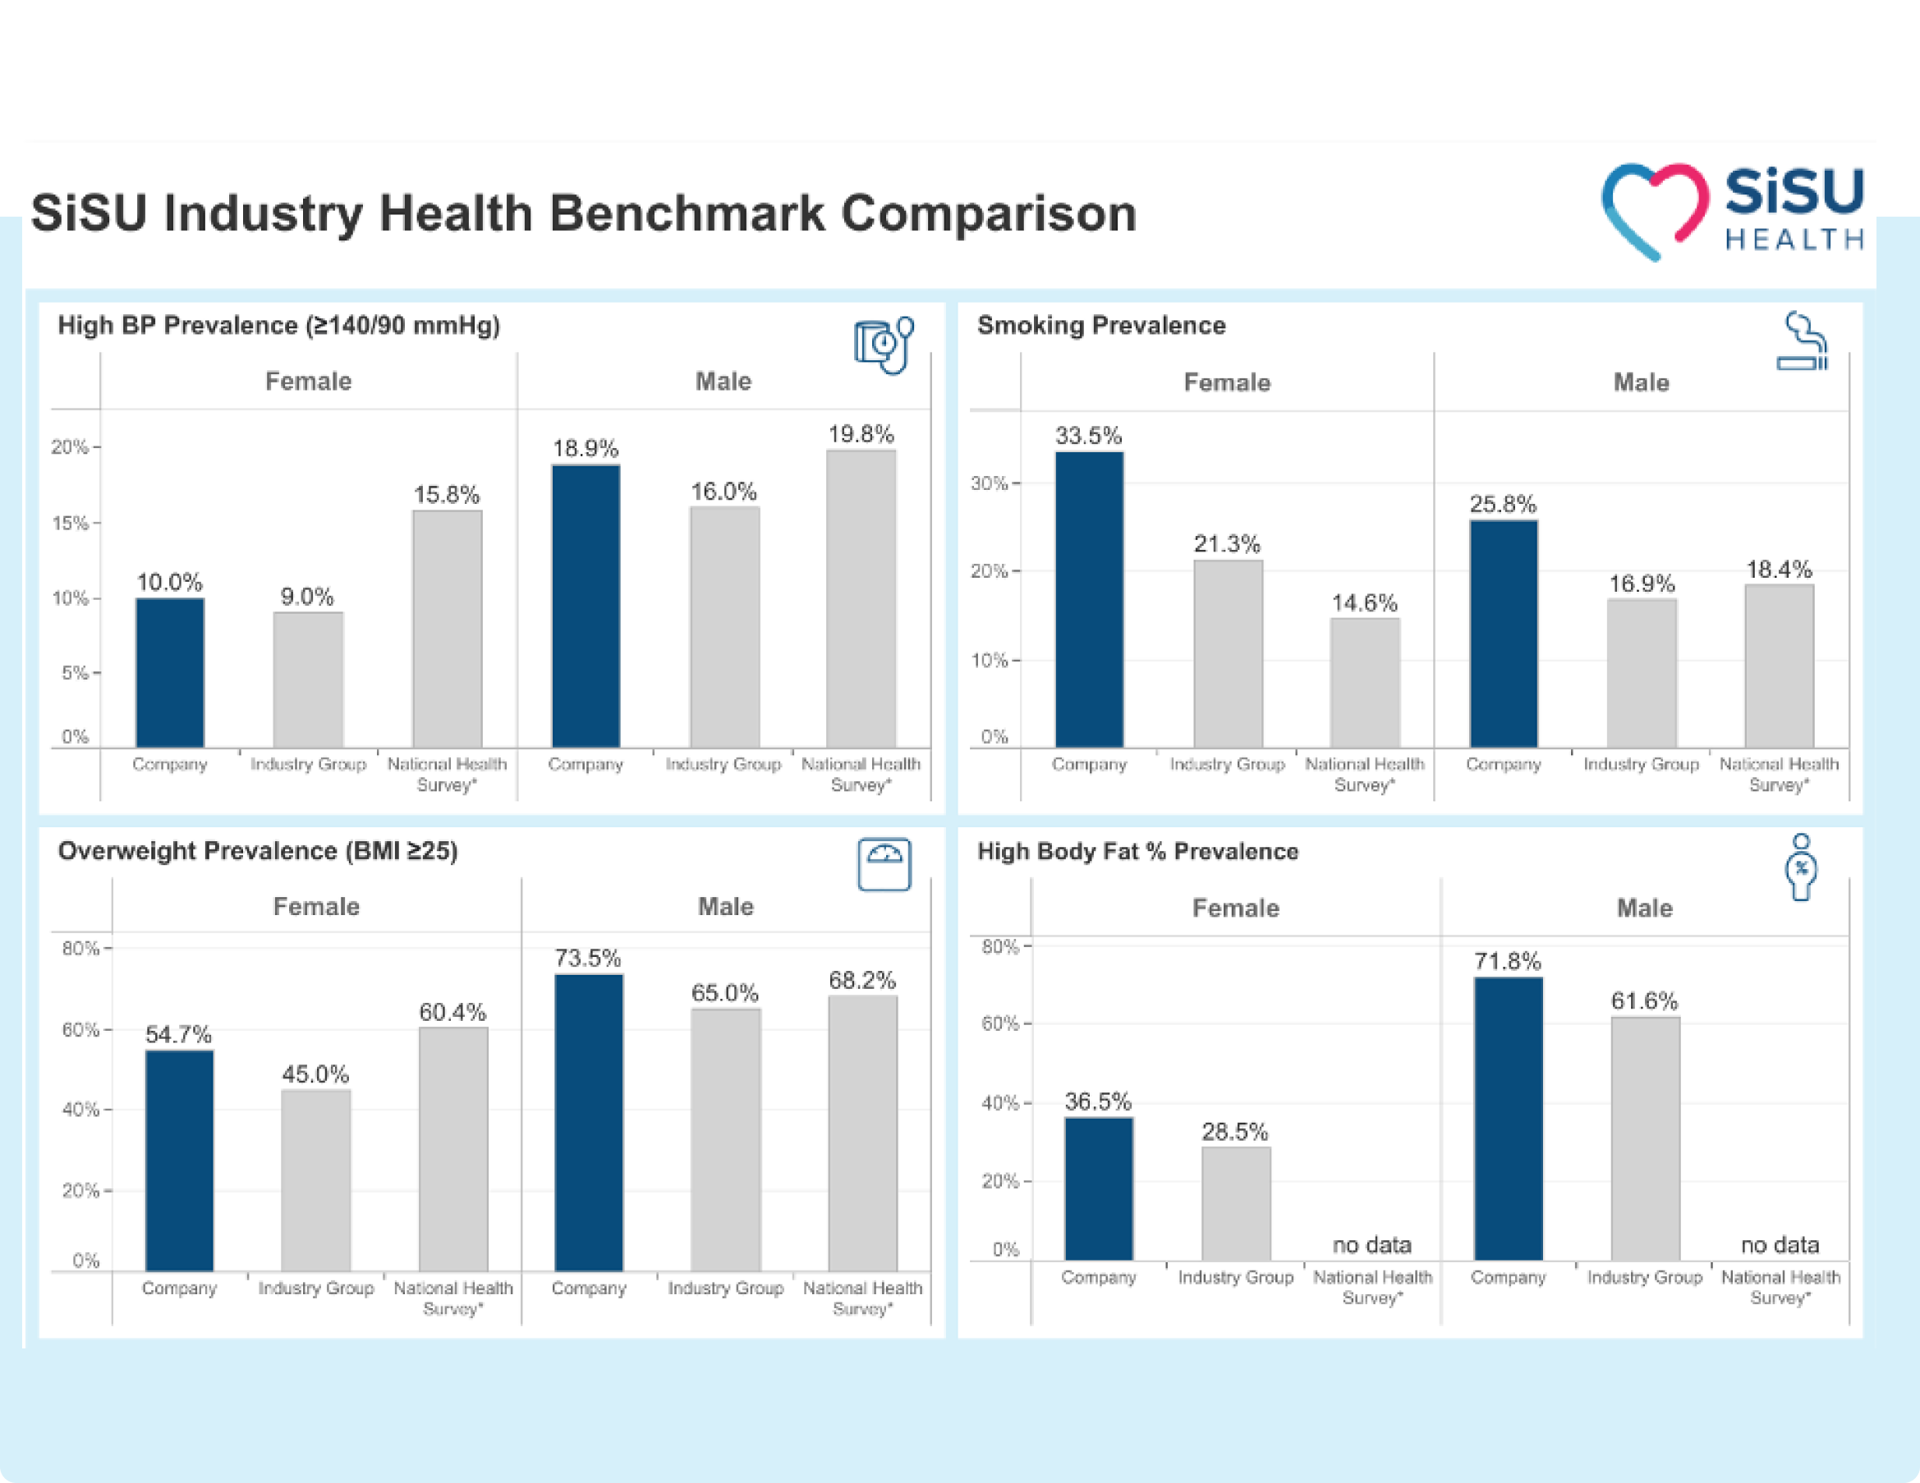
Global Industry & Population Health Benchmarking
Our Global Industry Health Benchmarking uses the world’s largest, real-time pool of de-identified, machine-measured employee health data to benchmark your organisation against both industry peers and the general population.
With a machine-measured pool of more than 560,000 health checks generated from nearly 700 organisations across 25 Industry Groups in four countries, our benchmarking provides an objective view of the relative health of your organisation versus competitors and national population health survey data.
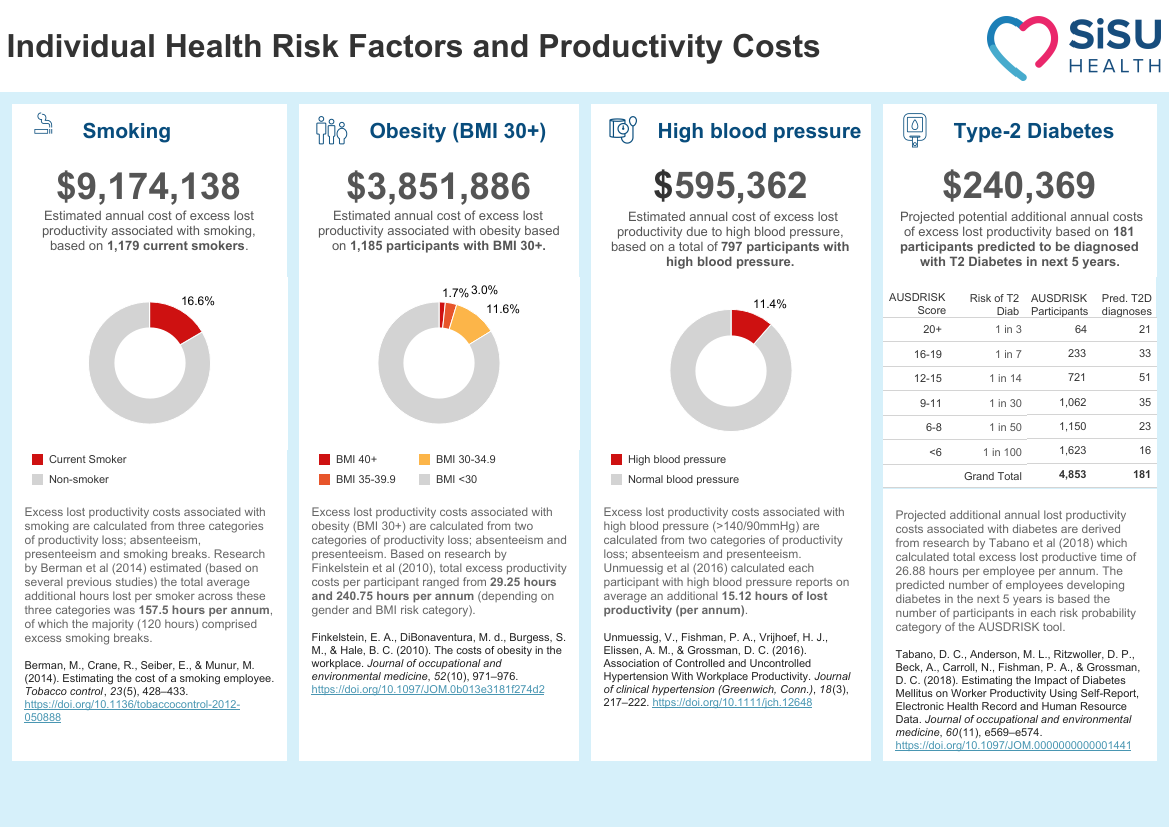
Productivity Cost Analysis
Using peer-reviewed, risk-specific research models, our Productivity Cost Analysis measures the annualised cost of specific health risks on employee productivity and an economic baseline to justify ongoing investment in employee health support.
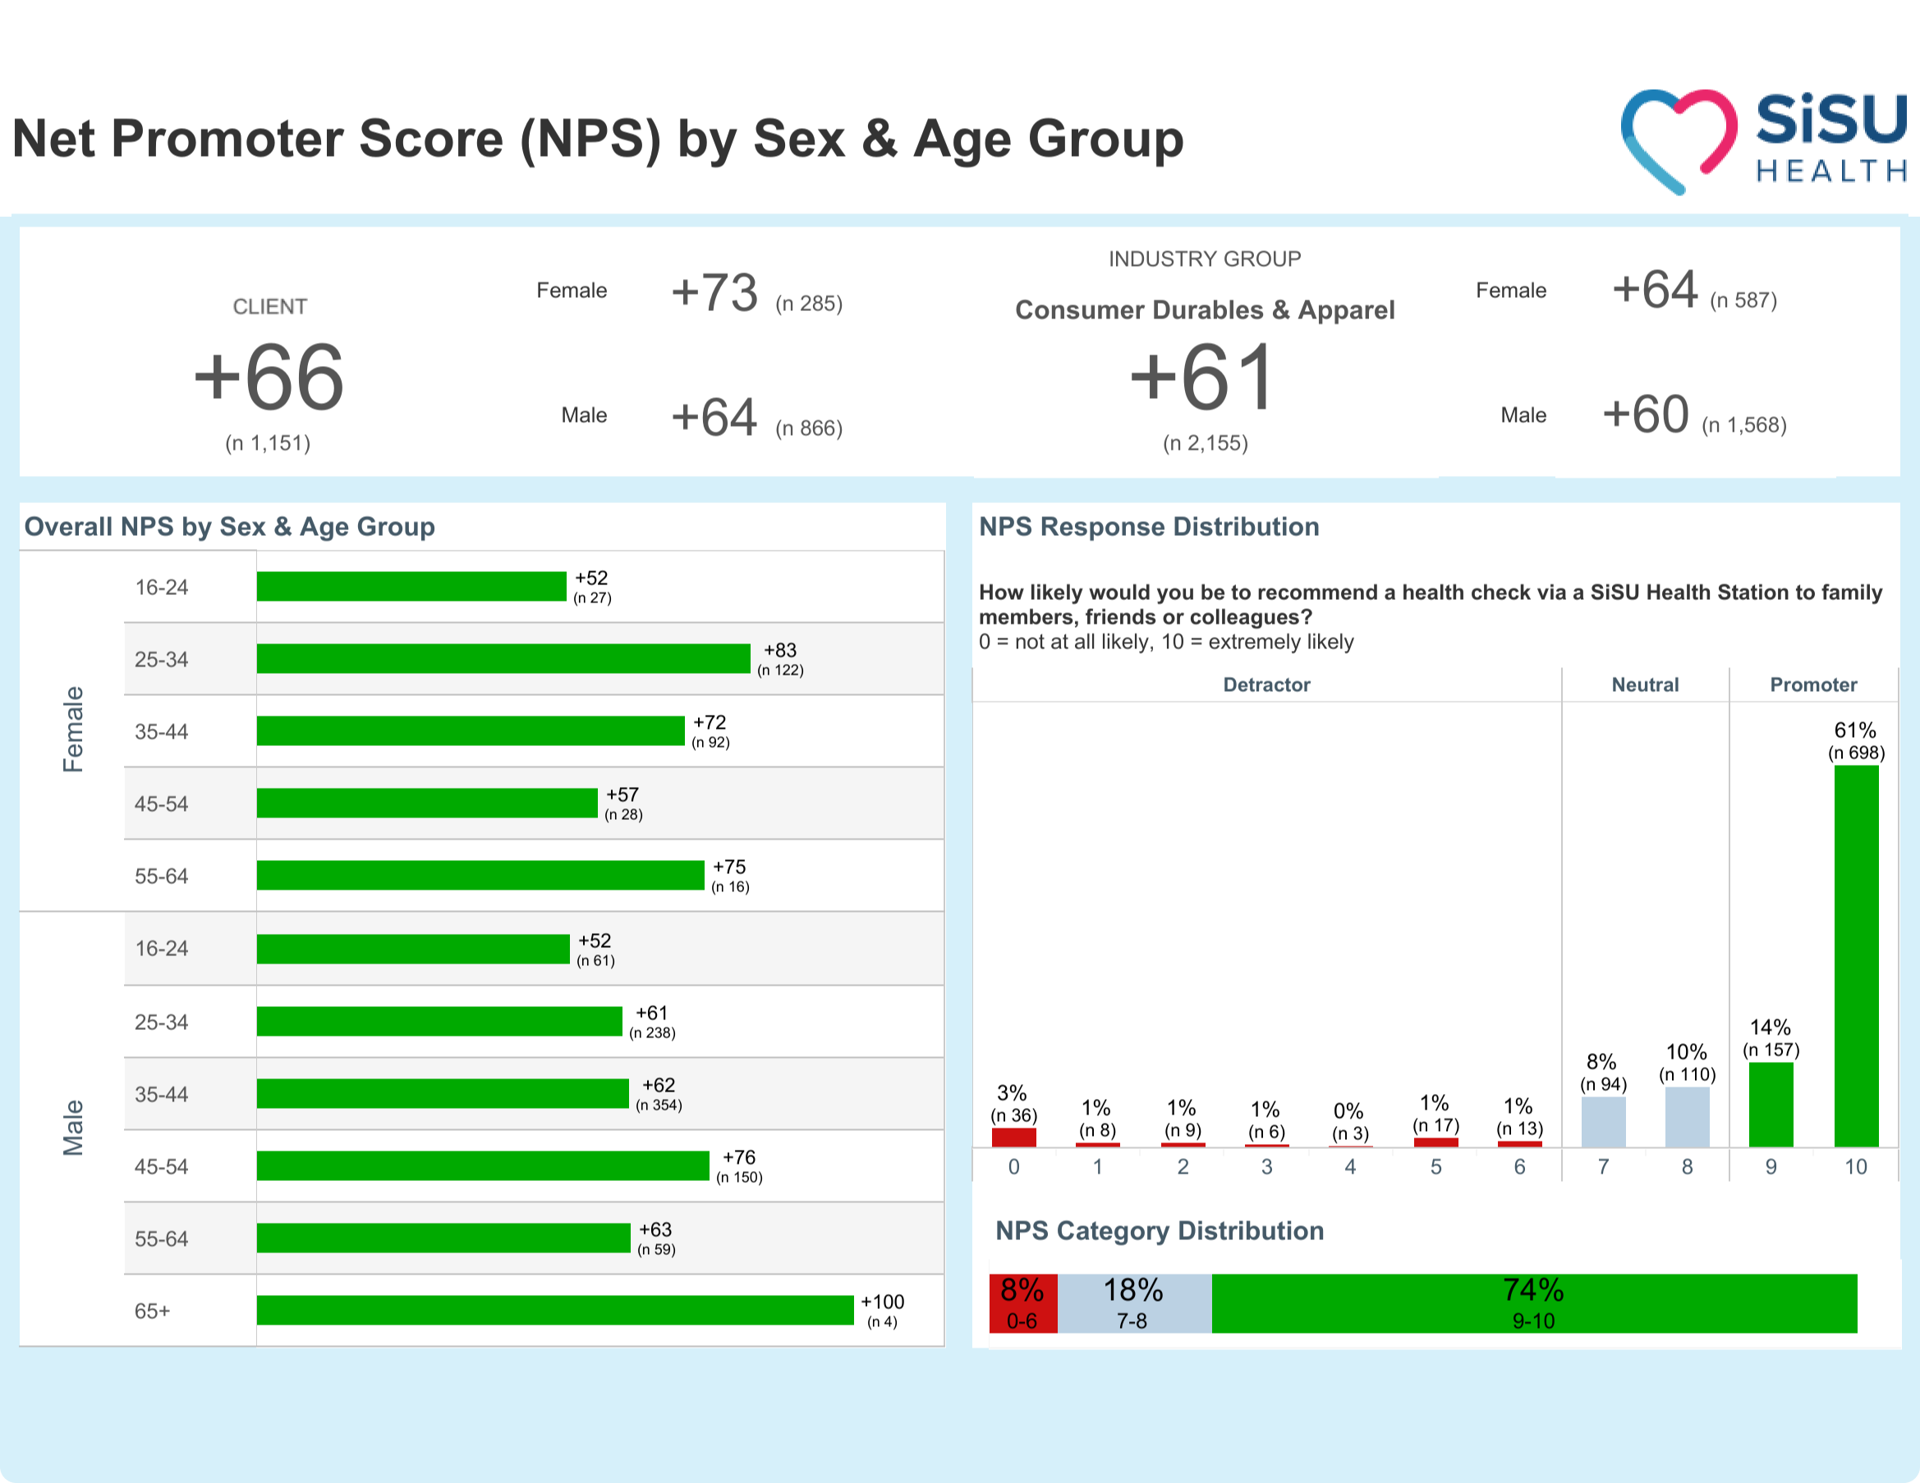
User Satisfaction (NPS)
Our analytics suite provides objective measurement and comparison of user satisfaction using the Net Promoter Score (NPS) system, a globally recognised method for measuring customer satisfaction and loyalty. Our NPS analysis provides breakdowns by sex, age group, versus Industry Group peers and the full distribution of promoter, detractor, and neutral scores.
In the spirit of reconciliation, we acknowledge the Traditional Custodians of Country throughout Australia. We recognise their continuing connection to land, sea and community and we pay our respects to Elders past, present and emerging. SiSU Health is dedicated to supporting better health and health outcomes for indigenous peoples across Australia. As of May 2025, we are proud to have provided more than 69,000 free health checks to more than 54,900 individuals of Aboriginal and Torres Strait Islander heritage across Australia.
^DISCLAIMER: The use of SiSU Health Products is not intended to replace medical advice from a qualified physician or healthcare professional. Always check with a qualified healthcare professional before making any changes to your health or lifestyle.
A Wesfarmers Company
Company
Office: L8, 637 Flinders Street, Docklands, VIC 3008
Manufacturing: 15 Islington Street, Collingwood, VIC 3066
(03) 9818 3998
Copyright © 2025 SiSU Health Group.
All rights reserved.